Breaking Down tilegen: A Deep Dive into Image Tiling
Ever zoomed in on a map and wondered how the experience is so smooth and snappy? That's thanks to tiled image rendering.
I recently built a tool called tilegen, which is essentially a tile generator that slices up a high-res image into thousands of tiles across multiple zoom levels, just like Google Maps does (well, almost). This post is a deep dive into what tilegen is, how it works, the quirks I ran into, and how mapping giants like Google do it too.
What's tilegen?#
At its core, tilegen takes a massive image (like a satellite photo, map scan, game world, or giant illustration), and cuts it into 256×256 PNG tiles across zoom levels. These tiles can then be loaded on demand by a viewer, allowing users to pan and zoom without downloading gigabytes of image data up front.
Key Features:#
- 🧵 Multi-threaded tile generation using
worker_threads - 🖼️ High-performance image manipulation via
sharp - ⚡ Uses Bun as its runtime
- 🔍 Auto-detects optimal zoom levels via a simple
MAXIMUM_MAGNIFICATIONconfig
Real-World Inspiration: Google Maps#
Before diving into the internals, let's look at what inspired it.
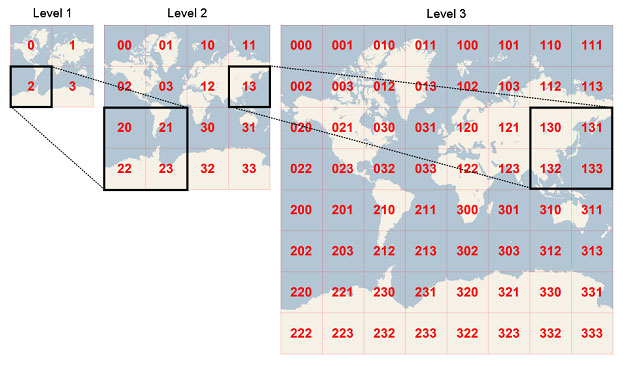
When you open Google Maps at zoom level 0, you see the whole Earth in a single square tile. At zoom level 1, it's split into 4 tiles. Zoom level 2? 16 tiles. It's exponential: → tiles = 4ⁿ at zoom level n
Each tile is 256×256 pixels. When you zoom in, you're not scaling a single image, you're loading tiles with more detail. This makes zooming in feel instant and seamless.

Does tilegen Use Mercator Projection?#
Short answer: No, and that's intentional.
Unlike Google Maps, which uses a Web Mercator projection (EPSG:3857) to project a spherical Earth into 2D tiles. Tilegen operates on raw pixel grids and assumes the image is already in a rectangular (flat) coordinate space.
This makes it perfect for:
- 🗺️ Game maps or dungeon blueprints
- 🖼️ Large digital artworks or posters
- 🧬 Scientific imagery or gigapixel scans
- 🧱 Anything that doesn't require geographic correctness
If you're working with real-world map data and want Web Mercator compatibility, you'd need to pre-project your raster image using GIS tools like GDAL or QGIS before running tilegen.
tilegen's Architecture#
Here's a view of what happens under the hood:
- Metadata Read: Uses
sharpto detect image width and height. - Zoom Level Calculation: Based on a value called
MAXIMUM_MAGNIFICATION. - Task Generation: Every tile for every zoom level becomes a task.
- Worker Thread Execution: Workers slice and resize specific tile sections.
- File Output: Tiles are saved into a
/z/x/y.pngfolder structure.
Zoom Levels and MAXIMUM_MAGNIFICATION#
Here's where the magic (and pain) happened.
Originally, I supported custom zoom levels. But this caused chaotic behavior, like tiles being mostly transparent, with the actual image squashed in the upper-left corner due to extreme padding.
So I killed that idea in favor of one elegant constant:
MAXIMUM_MAGNIFICATIONWhat does this mean?#
This defines how deep the user can zoom in relative to the base image's pixel density. It doesn't literally scale the image, but rather controls how many zoom levels should exist so that even the deepest level looks sharp.
This avoids all the padding headaches and keeps the tiles perfectly aligned.
Smarter Tile Quality#
Not all tiles need to be lossless.
The user doesn't need zoom level 0 (the whole image) to be razor-sharp. So tilegen adjusts quality:
- 🧊 Zoom levels 0-2: Use slightly lossy PNG compression to save disk space.
- 🔍 Deeper zooms: Full PNG quality for close-up inspection.
This makes a huge difference on disk usage without affecting perceived quality.
Performance#
tilegen spins up worker threads, one per CPU core. Each worker pulls tasks off the queue and works on one tile at a time.
Here's a snippet of how tile jobs are assigned:
for (let i = 0; i < cpus().length; i++) {
  const worker = new Worker(...);
  dispatch(worker);
}
The main process manages the pool and displays a ASCII progress bar, complete with ETA and tiles/second metrics.
The Weird Stuff#
This wouldn't be a proper project without facepalms:
- 😤 Empty tiles at high zooms: Originally caused by over-padding during custom zooms. Solved by switching to computed zooms.
- 🤯 Sharp's resize behavior: If you extract a tiny area and resize it to 256x256, the result can be fully transparent. Needed better offset handling.
So, Why Build This?#
I wanted something fast, transparent, and flexible, a tool that could help generate tiles for any large static image, not just maps.
I also wanted something that used Bun by default, because Bun is… well, fun.
Other tools like MapTiler, GDAL, and gdal2tiles exist, but they're heavy or GIS-specific. tilegen is simple by design and powerful when needed.
What's Next?#
I'm thinking of:
- 🧪 CLI support
- 🧼 WebP and AVIF tile support
- 🧭 Vector tile generation (just for fun?)
- 📦 JSON tile manifests (TMS compatibility)
- 🌍 Maybe even Web Mercator pre-projection
Final Thoughts#
Whether you're visualizing old parchment maps, building a giant RPG overworld, or just want to zoom into a 50k×30k engineering schematic, tilegen makes tiled rendering effortless.
If Google Maps can do it, so can we, minus the satellites.
Stay tuned, there's more to come.
This project is open-source and is available at itsbrunodev/tilegen.
You've reached the end. Thanks for reading!